UniGlobal Job Data Visualisation
We like collecting data. But most importantly, we also like to analyse and visualise it. So what we’ve done over the past 2 years is try to make sense of the data that was available and highlight certain trends in the indsutry that can be potentially used to make informed recommendations.
The dashboards provide insights into job opportunities, categories, and salary distributions across institutions globally. Please note, this data was collected over the past two years from our website and reflects only the job postings that were available to us during that time. It does not represent the complete scope of all available jobs globally. To better explore the data, please use read the brief explainers below:
- Total Job Counts and Categories
- Distinct Job Titles
- Institution Job Categories
- Job Titles vs. Job Categories
- Salary Insights
- Country and City Insights
- Limitations
- Job Count (1,711): The total number of job postings across all institutions and categories. This includes duplicate entries where the same job title is listed by multiple institutions or falls under multiple categories.
- Job Categories (10): The broader groupings or “buckets” under which job titles are organised, such as International Student Recruitment, Senior Leadership Roles etc.
Distinct Job Titles (1,139): The number of unique job titles across all postings, meaning some job titles are repeated across different institutions or categories. For example, “International Recruitment Officer” may appear multiple times.
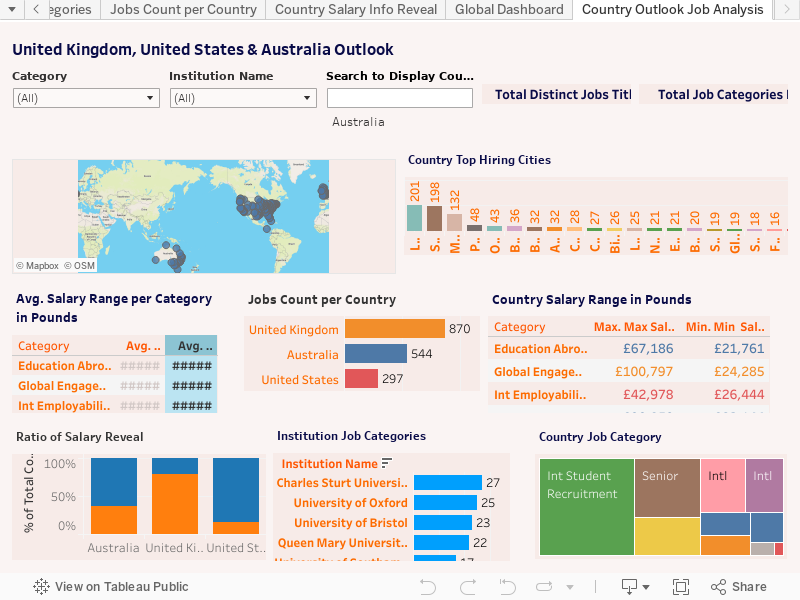
This section shows the number of job titles advertised by each institution.
For example, Charles Sturt University has 27 job titles listed across various categories.
Job Titles: Specific positions such as International Recruitment Officer.
Job Categories: Broader groupings such as International Student Recruitment, under which job titles are classified.
For example:
If 50 job titles fall under International Student Recruitment, this category is “mentioned” 50 times, even though the job titles are distinct.
The salary ranges are broken down by category (e.g., Senior Leadership Roles) and show:
-
- Max Salary: The highest salary offered in this category.
- Min Salary: The lowest salary offered in this category.
This allows you to compare salary ranges across categories and evaluate trends by country or institution.
- Jobs Count per Country: Displays the distribution of job postings across countries. For instance, the UK has 870 postings, followed by Australia (544) and the US (297).
- Top Hiring Cities: Shows the cities with the most job postings. For example, London has the highest number of postings (201), followed by Sydney (198).
This data reflects job postings collected over the past two years on our website. It is limited to the job opportunities we were able to access during this period and may not represent the full range of jobs available globally. As such, this dashboard provides a snapshot of trends rather than a comprehensive overview.
Any questions or feedback about our data? Please get in touch using the below form